One week after we started using BigQuery, the head of IT came calling? “What are you doing? Did you know you spent $200 yesterday in BigQuery? How long is that going to go on?” Even though he knew we had a major project, he was surprised about the expense.
Our team of two laughed to ourselves. We knew that our salaries were far more than the BigQuery expense. That’s not the point, though. And it’s not the point that trying to build your own data warehouse instead of using BigQuery could cost an enormous amount of money. The problem was unpredictable expense.
BigQuery, like most cloud services, bills you depending on your usage. It’s a variable cost – the more you use it the more it costs. That’s a problem for IT managers. At the beginning of the year they create a budget with Finance. Their bonus depends on whether they hit their expense target. Unexpected expenses take real money out of their pocket. And they can shut you down.
How expensive can it be?
Streaming data was stuffing about 150MB a day into our tables – primarily metrics from sensors, but also configurations and log files. Storage is quite inexpensive, only $20 per TB per month. That didn’t bother the IT manager. What bothered him was our query costs.
Queries are charged based on how much data is read. Read a TB of data, pay $5. Is that a lot? Turns out, yes it is.
Our first incredibly simple report helped us understand what kind of data we were collecting.
- Query 1 – count data points per day – “How much data are we collecting?”
- Query 2 – count types of data points per day – “What kind of data are we collecting?”
- Query 3 – count amount of data by data source per day – “Where is the data coming from?”
- Query 4 -count types of data by data source per day – “Are the data sources different?”
Whenever we ran the report, it ran the four queries over the ~60 days of data we had (1TB), costing us about 20 cents. Not bad, although it the expense went up by a little less than a half cent per day as we added more data.
Interesting reports came in around $5 each. Multiple graphs, multiple joins, multiple subqueries. During development we were running them all day long to get things right. That’s how we got to $200/day. And once the reports were finished, other people would be running them too.
This was a problem. If we couldn’t control our costs and explain to the IT manager what happened and what we were doing about it our project was going to end before it even started. Our bonus depended on the project, so we were motivated.
Three quick fixes: browser extension, using date partitioning, shared standard views
With three quick fixes we mollified the IT manager and reduced our expenses.
Fix one was the simplest. There’s a cool Chrome extension that adds estimated cost to every query – and it shows the cost before the query runs. It provided the visible proof we needed to show the IT Manager that we cared about cost, and that we could control expense.
Fix 2 was fairly simple. We had to stop reading the whole table for every query. We’d built the table with date partitioning – but we hadn’t been using it. We added WHERE clauses with dates to all of our queries. For most of our development we could use just a day’s worth of data -less than a half cent per query – cutting our development expenses almost 90%.
Fix 3 was to ensure the rest of the team used date-centric queries. We wrote several standard views that included WHERE clauses with built-in date ranges and encouraged people to use the right query for the report they needed by letting them know that queries ran much faster with the right range.
The date ranges in the views we provided were a day, a week, a month, and last month. Here’s a snapshot of one way to create the appropriate ranges.
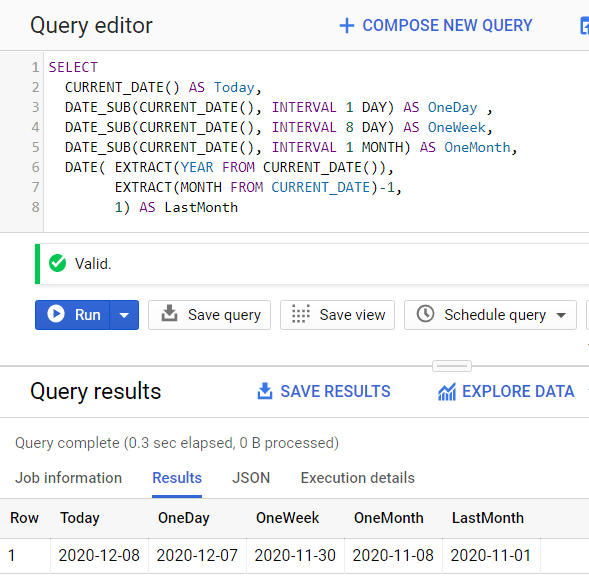
Views are built with one of the date expressions. For example,
WHERE metricDate >= DATE_SUB(CURRENT_DATE(), INTERVAL 8 DAY)
You’ll notice that for me a week is 8 full days and today’s partial data. That worked better for us because it turned out people meant two different things by “one week” and this definiton suited both. Arguing about date math is fairly pointless, we decided.
After we applied our fixes, we walked the IT manager through how we were lowering expenses. Showed him how the extension reminded us of costs for every query, explained date partitioning, and used the extension again to illustrate how the date-centric views were much cheaper than using the full table. We also used billing data to prove that our BigQuery expenses had dropped from $200/day to $20/day.
The IT manager was happy, our project was still on, and all our bonuses were still in play.
Do you want to keep your projects running?
BigQuery is an amazing place to work, but there’s a ton to learn and documentation is never specific enough.
Save time with useful new content delivered directly to your email. Unsubscribe anytime. I don’t share your email address with anyone.
